

Parameter Examples
As described in the overview, parameters are a powerful analytic feature that enable report and query designers to deliver complex functionality in a report - without the need for SDK's or cube designed functions that are often convoluted or limited.
The following examples will highlight how parameters can be used in analytics. All examples are based around the date dimension. However, the logic and ideas can be extended to any hierarchy and situation. The last example covers the use of parameters with the Story Board tool.
See multi-mode for variations on the treatment of multi-selected parameters.
Within the BI User Community, a number of videos, webinars and blogs are available on the topic of parameters https://community.pyramidanalytics.com
Example 1: Basic Parameters
Use this functionality when you want to compare to simple choices side by side in your analysis.
| Step | Result |
|---|---|
|
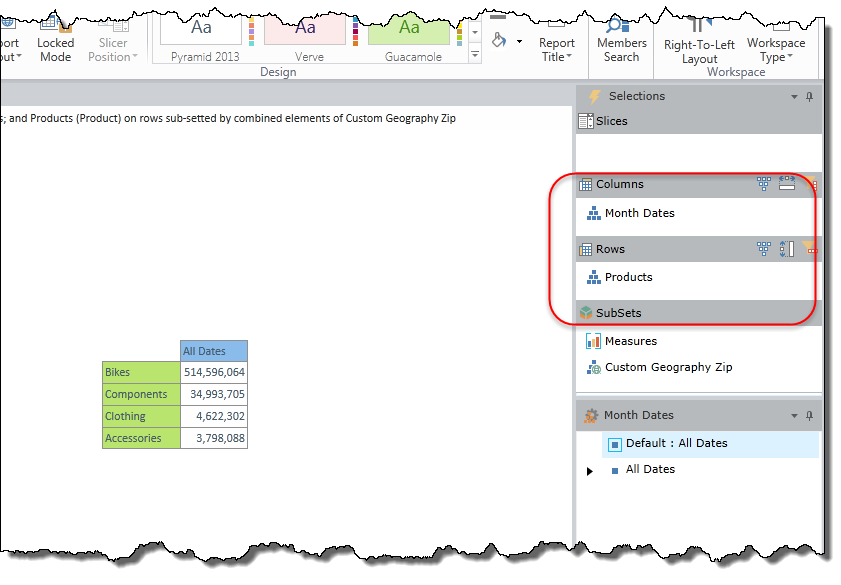
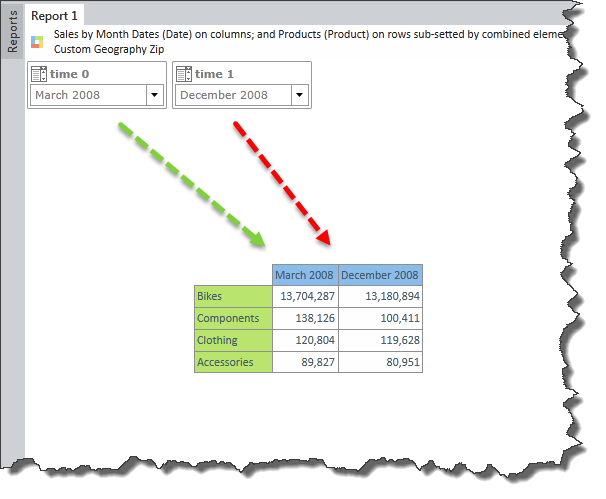
Put the date dimension on the columns and the products dimension on the rows. |
|
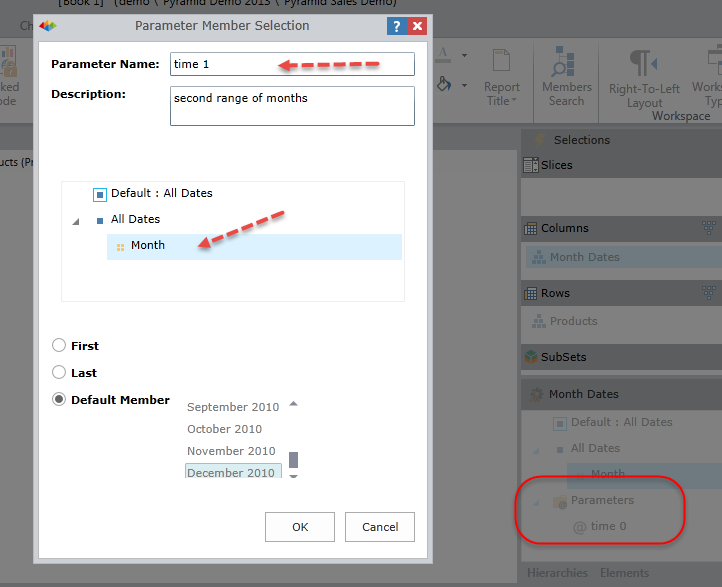
| As described in the overview, create two parameters on the date dimension, using the month level as the parameter content for both. Name the first "time 0", the second "time 1". |
|
|
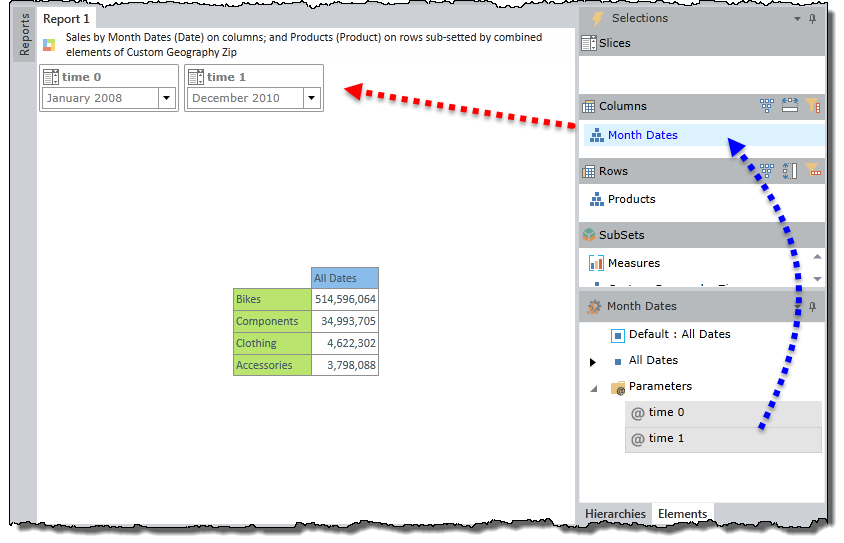
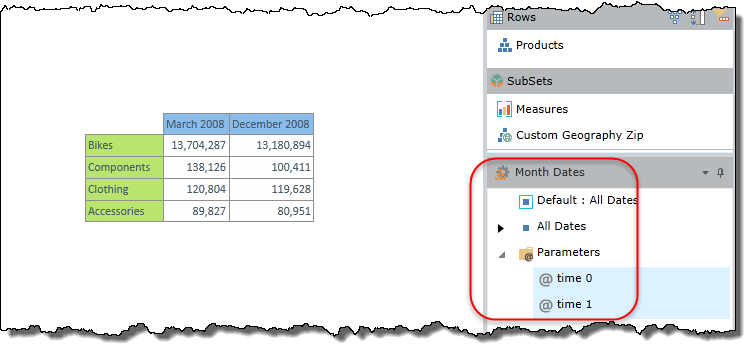
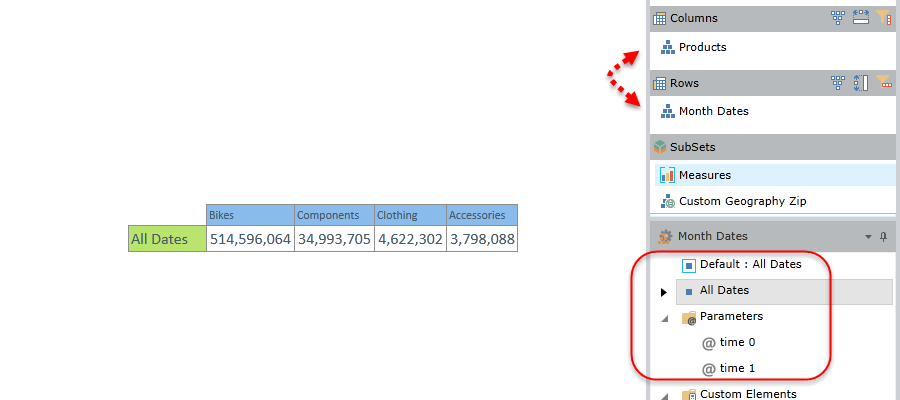
In the date elements tree, select the two parameters. The date dimension in the selection tree will turn blue and two slicers for time 0 and time 1 will be added to the report canvas. |
|
|
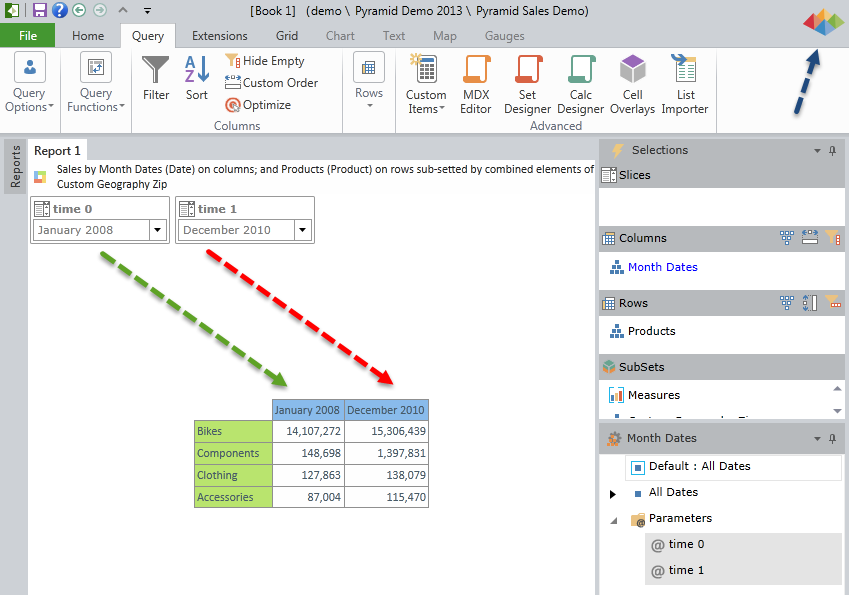
Click the run button. The two parameters now reflect the current selections from the slicers. |
|
| Change a selection in the slicers and run the query again. You'll notice that the result set now reflects choices made in the runtime slicers. |
|
Example 2: Parameters with a Custom Calculation
Use this functionality when you want to compare to simple choices side by side in your analysis and show a variance between them.
| Step | Result |
|---|---|
|
Repeat the steps of example #1 above. |
|
|
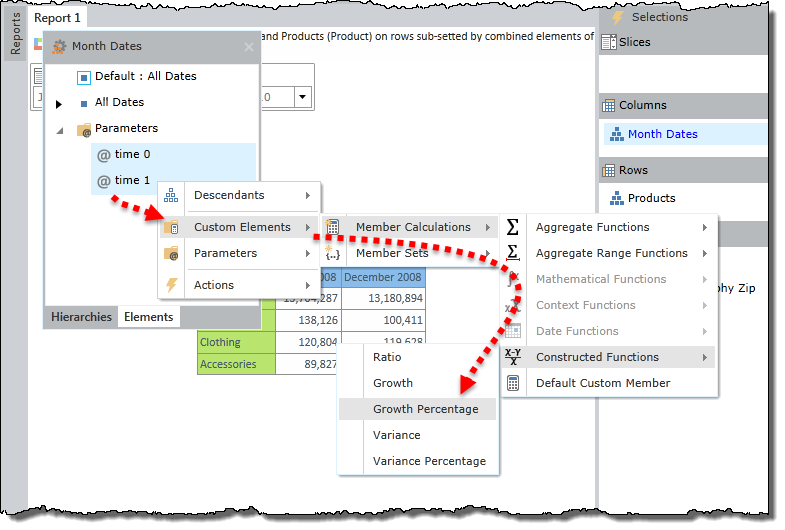
In the date elements tree, select the two parameters. Right click, and choose custom elements > member calculations > constructed functions > growth percentage. In the pop-up dialog, just click "create", to build a new custom member that is the growth between the parameters. |
|
|
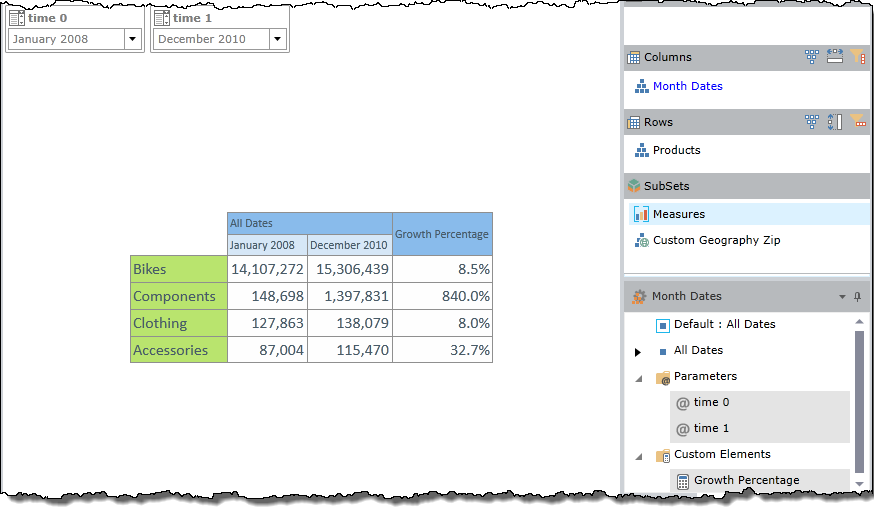
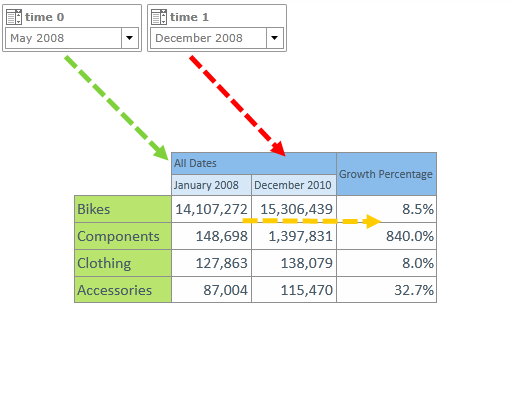
Back in the elements tree, select time 0, then time 1 and then the new custom calculation from the previous step. Click the run button. The result reflects the two choices from the slicers and a variance between them. |
|
| Change a selection in the slicers and run the query again. You'll notice that the result set now reflects choices made in the runtime slicers with the variance calculation AUTOMATICALLY redefining itself to reflect those two new choices. |
|
Example 3: Parameters with a Custom Set
Use this functionality when you want to create a RANGE of elements starting from the first parameter to the last parameter. This can be a super convenient way to create year-to-date ranges without hard coding the selections into a cube's definition.
| Step | Result |
|---|---|
|
Repeat the steps of example #1 above. |
|
|
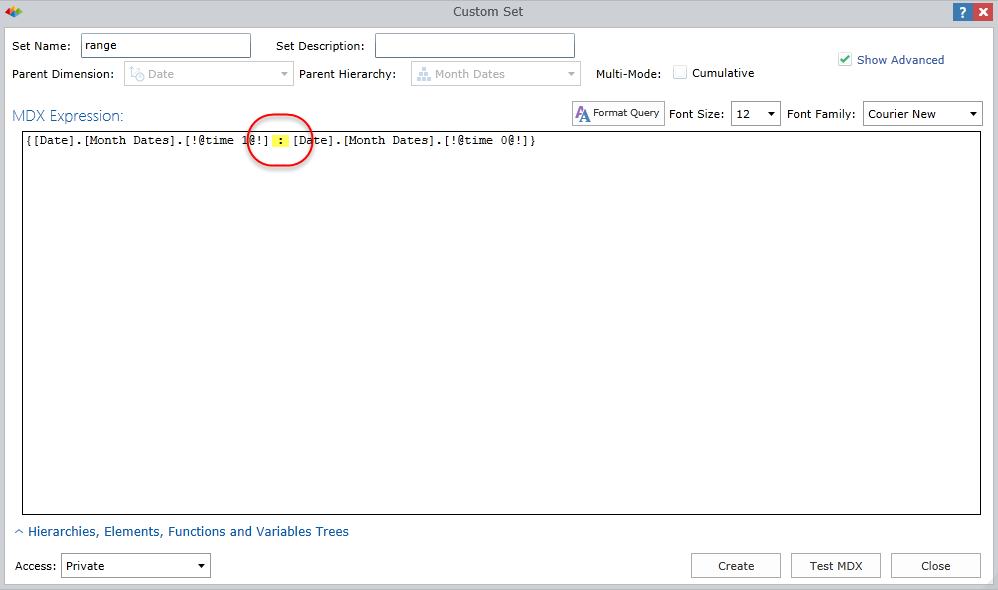
In the date elements tree, select the two parameters. Right click, and choose custom elements > create custom set. In the pop-up dialog, name the set "range" and then edit the MDX and change the middle comma to the colon ":" operator. This minor MDX tweak will tell the engine to select all elements starting with the first parameter and select all elements up to the last parameter. |
|
|
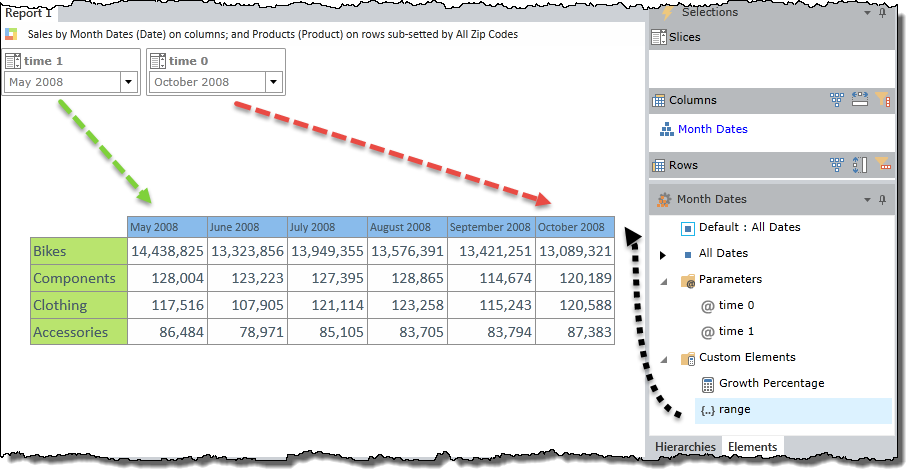
Back in the elements tree, select the new "range" custom set and click the run button. The result reflects a range of months from the first parameter selection until the second parameter selection. |
|
Example 4: Parameters with Derivative Functions
Use this functionality when you want to select other elements based on the parameter selection. With custom MDX, this logic can be extended in many ways. This example covers an example using the point-and-click options in the element tree.
| Step | Result |
|---|---|
|
Repeat the steps of example #1 above. Pivot the query, so dates are on the rows now. |
|
|
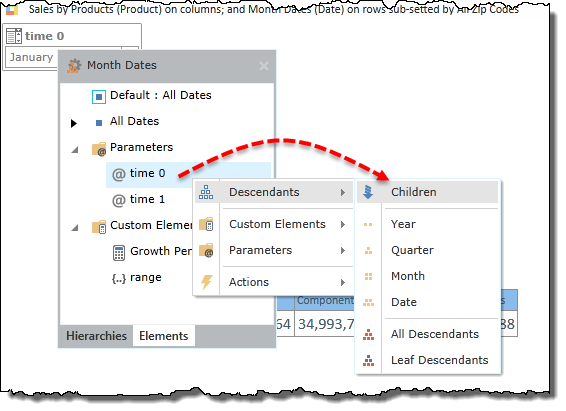
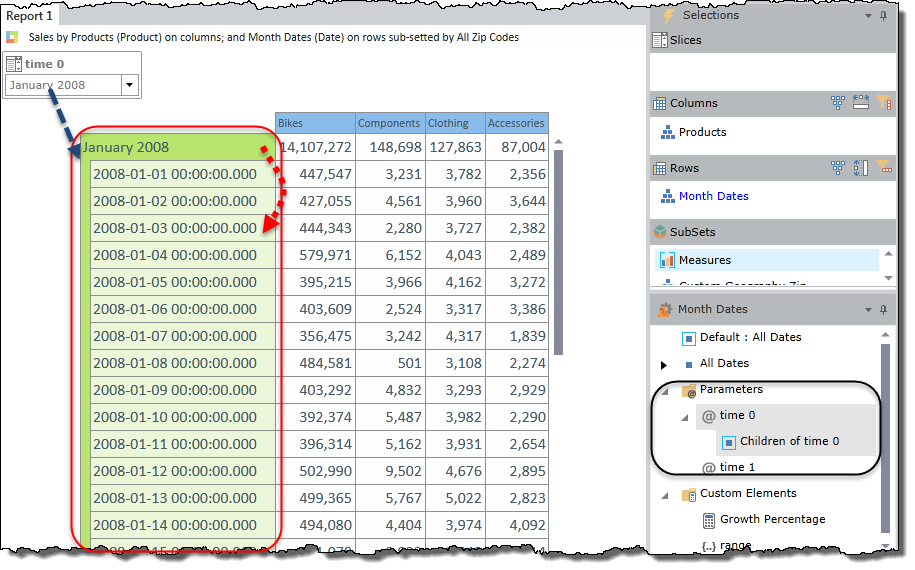
In the date elements tree, select the one of the parameters. Right click, and choose Descendants > Children. |
|
| Now select both the parameter node and the "children" node in the element tree and click the run button. The result reflects a range of dates in the selected month as well as the month itself. Changing the parameter slicer, will produce a different time range and a different set of "children" elements automatically. |
|
Example 5: Parameters in Story Board
Use this functionality when you want to parameterize a second query in the Story Board interface with the interaction selections made in a second query. Also see Interactions and Parameters.
| Step | Result |
|---|---|
|
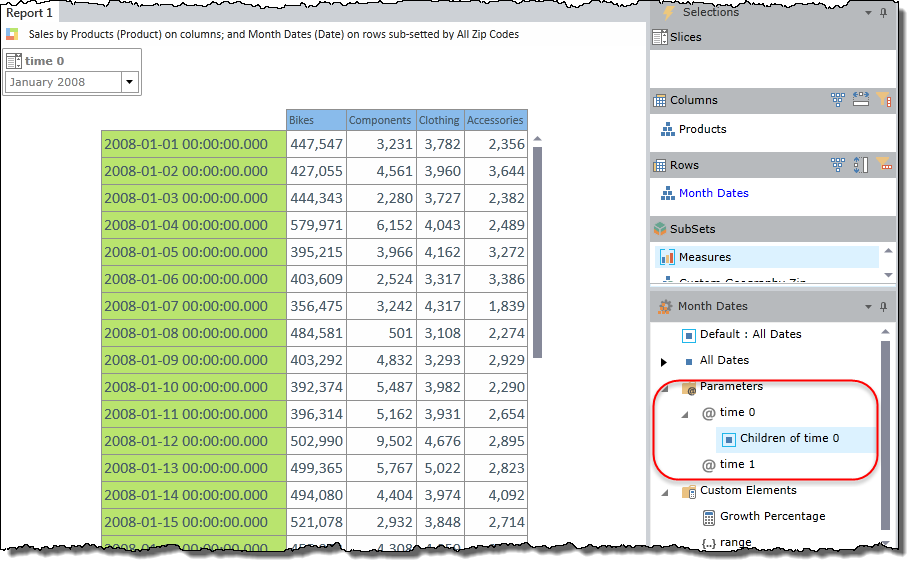
Repeat the steps of example #4 above, except only select the children node. Save the report as "month parameterized". |
|
|
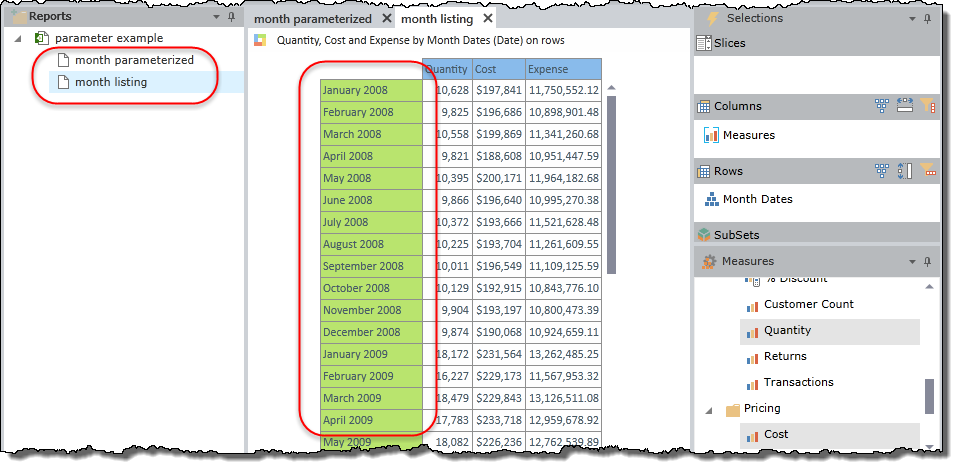
Create a second report in the book. This time put a listing of months on the rows. Save the report as "month listing". |
|
| In Story Board, create a side by side layout, and place the above two reports onto the slide canvas. |
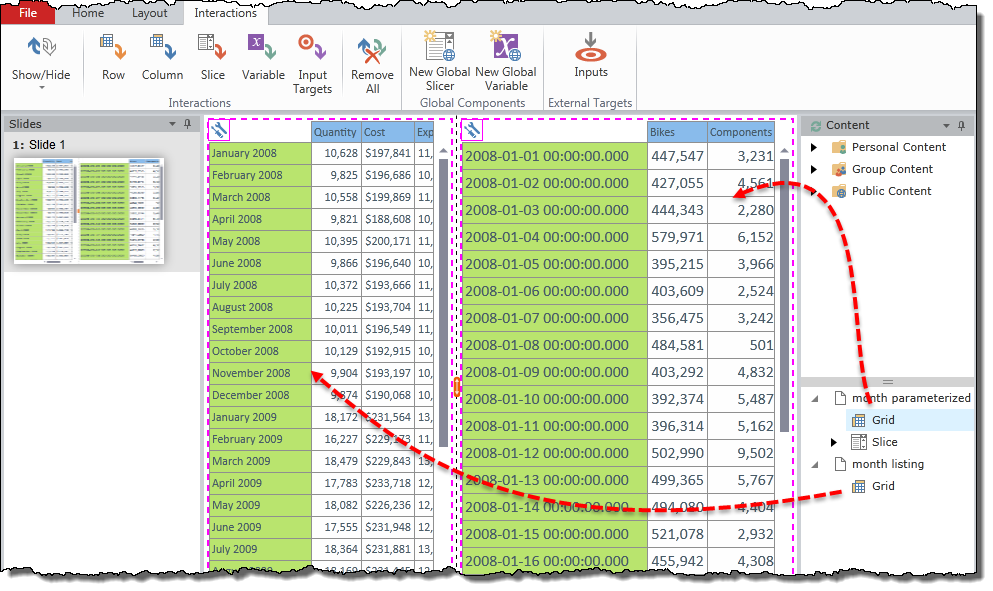
|
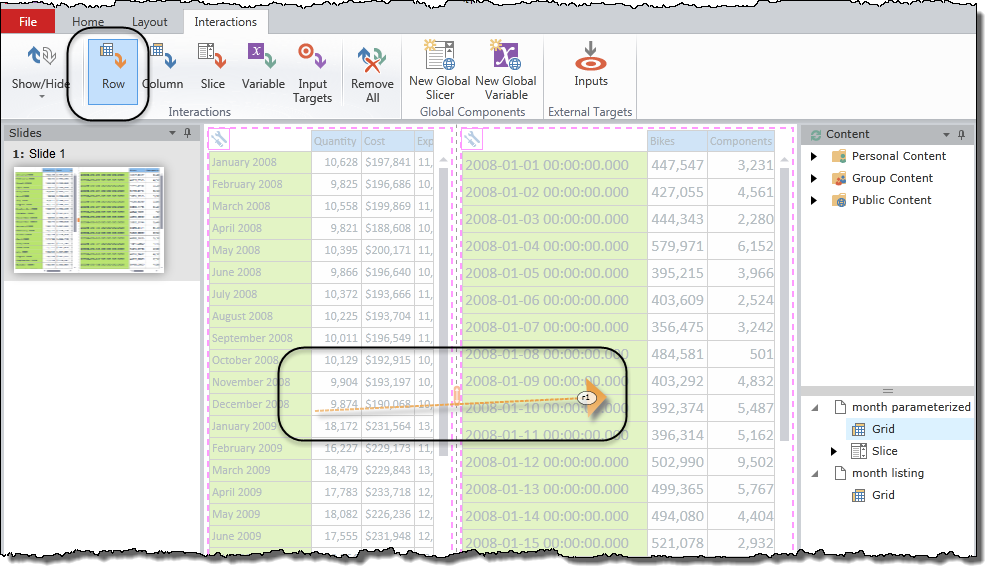
| Now draw a row interaction from the month listing panel to the month parameterized panel. |
|
| Launch the dashboard into runtime and right click on a month in the month listing panel. Choose Interact. |
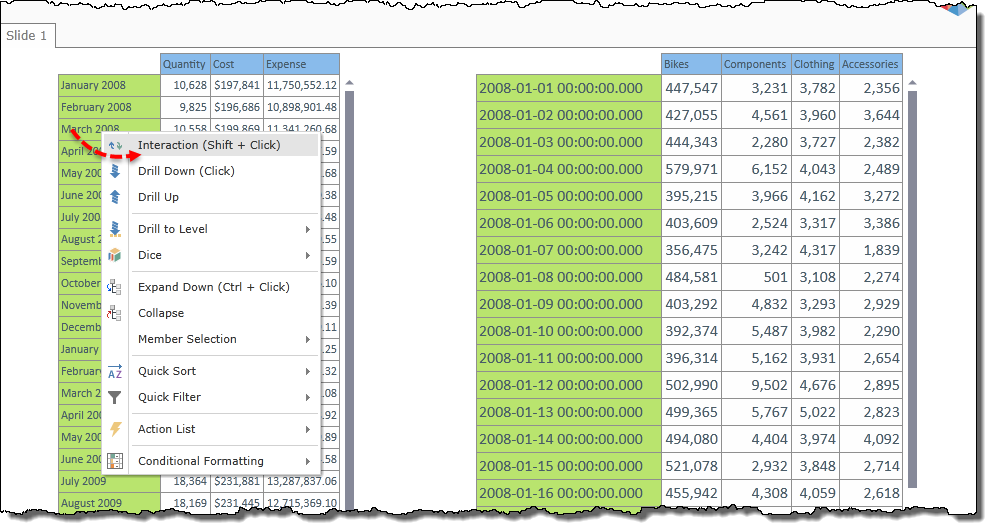
|
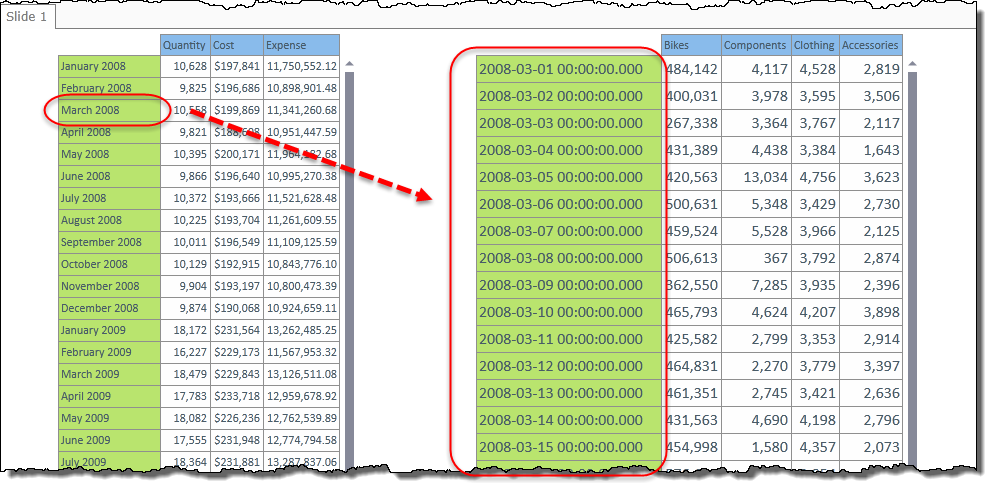
| The month parameterized query (on the right) now reflects all the days in the selected month (from the left) used in the interaction from the previous step! |
|
Home |
Table of Contents |
Index |
User Community
Pyramid Analytics © 2011-2022